A figure legend is the text that explains a figure, so a reader can follow it without the main text. It usually starts with a number and a short title, then says what each panel shows and defines the symbols, abbreviations, error bars and statistics. Where it goes and how long it can be depend on whether you’re writing a thesis, a journal paper or an assignment in APA Style.
If you’re writing a lab report, a thesis or a journal paper, this guide shows you how to write a figure legend. It sets out what to include and builds an example step by step. Then it compares the rules from Nature, PLOS ONE, Wiley, APA Style and a UK university.
What is a figure legend?
A legend is the block of text attached to a chart, image or diagram that tells the reader what they’re looking at. Nature asks for one that begins with a brief title for the whole figure. It should continue with ‘a short description of each panel and the symbols used’.
The words legend, caption and key overlap, and that causes confusion:
- Journals such as Nature, PLOS ONE and Wiley’s journals use ‘legend’ for the explanatory text. PLOS ONE calls the whole block a ‘caption’: a label and title, which are required, plus an optional legend.
- APA Style uses ‘legend’ differently. If there is one, an APA legend, or key, sits inside the image’s borders and explains its symbols. Any explanation below the image goes in a ‘note’, added only as needed.
What this means for you: check which meaning your guidelines use before you start. If you’re following APA, what a journal calls the legend becomes a note below the image.
A legend adds to clear labels; it doesn’t replace them. As Daniel Klionsky writes in the journal Autophagy: ‘Ideally, the reader/reviewer should not have to refer to the figure legend to understand the figure.’ So put the key information on the image itself and keep the legend for detail, unless your journal says otherwise. Nature, for one, prefers keys to symbols in the legend.
What should a figure legend include?
A good legend includes a number, a title and whatever a reader needs to interpret the data without hunting through your text. The table shows each part and where the requirement comes from.
| Part | What to write | What the rules say |
|---|---|---|
| Number | Figure 1, 2, 3… in the order you mention them | Wiley: Arabic numerals in order of appearance. PLOS ONE: ‘Fig 1’, ‘Fig 2’ |
| Title | One short phrase or sentence covering every panel | Nature: a brief title for the whole figure. PLOS ONE: concise, 15 words or fewer |
| Panels | What each part shows, labelled (A), (B) and so on | Nature: a short description of each panel. PLOS ONE: describe each part with a lettered panel label |
| Symbols and abbreviations | Spell out abbreviations and unusual units; explain colours, lines and symbols | Wiley: explain any abbreviations or symbols. PLOS ONE: define all non-standard symbols and abbreviations. Nature: define unusual units or abbreviations in the legend |
| Statistics | What the error bars show (for example, standard deviation), the sample size and the test | Nature: all error bars and statistics must be defined in the legend |
| Methods | Only the detail a reader needs to interpret the data | Nature: no methods details if the paper has a Methods section. PLOS ONE: avoid lengthy descriptions of methods |
| Credit | Source and permission for an image you didn’t create | Wiley: state re-used images in the legend with the citation. PLOS ONE: credits go in the last sentence |
Sources: Nature formatting guide; PLOS ONE and Wiley guidelines on figures.
The aim is the one PLOS ONE gives: describe the key messages so readers can understand the figure ‘without referring to the text’. So don’t copy your results paragraph in. Say what’s shown, then define anything a reader could misread.
A figure legend example, built step by step
The example below is our illustration of how the parts fit together. It describes a made-up experiment, not real results.
Say you have two panels. Panel (A) is a bar chart of plant height after three weeks under three light levels, and (B) shows one plant from each group.
- Number and title. Start with the number and a title that covers both panels: Figure 3. Effect of light intensity on seedling height.
- Panel A. Say what is plotted and what the bars show: (A) Mean height of seedlings after 21 days at low, medium and high light. Bars show means; error bars show ± standard deviation; n = 10 plants per group.
- Statistics. Name the test and what the symbols mean: Asterisks mark significant differences from the low-light group (P < 0.05; one-way ANOVA followed by Dunnett’s test).
- Panel B. Describe the images and the scale: (B) Representative seedlings from each group at day 21. Scale bar, 2 cm.
Figure 3. Effect of light intensity on seedling height. (A) Mean height of seedlings after 21 days at low, medium and high light. Bars show means; error bars show ± standard deviation; n = 10 plants per group. Asterisks mark significant differences from the low-light group (P < 0.05; one-way ANOVA followed by Dunnett’s test). (B) Representative seedlings from each group at day 21. Scale bar, 2 cm.
Put together, it reads as one block under the image, or wherever your guidelines require. At about 70 words, it’s well under Nature’s limit of fewer than 300, and a reader can follow both panels without your results section.
Examples from published papers
Published legends vary a lot in length and detail. When you read a journal article in your field, look at how its legends handle titles, panels and statistics. The three below come from 2020 papers. Click an image to open its paper.
- Scientific Reports: 2018 floods at Bosra and Sergiopolis in Syria, seen from satellites
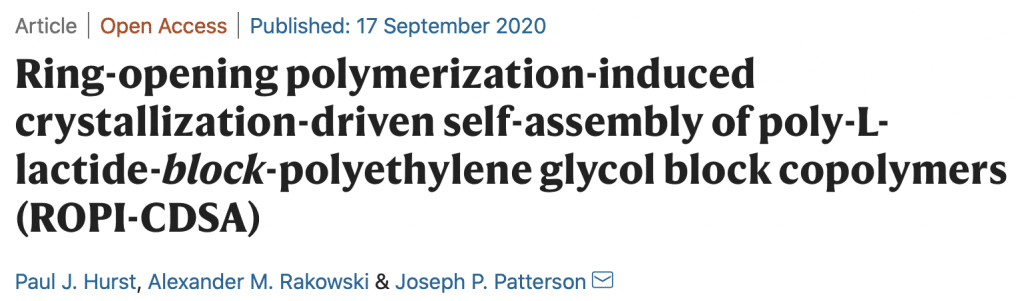
- Nature Communications: self-assembly of poly-L-lactide block copolymers
- Biosensors and Bioelectronics: X: explosive sensing with insect-based biorobots


Where does the legend go, and how long can it be?
Where it goes depends on what you’re writing. The rules below come from three publishers, APA Style and one UK university, and they don’t all agree. So follow the rules for where your figure is going.
| Guidelines | Where the legend or caption goes | Length and format |
|---|---|---|
| Nature | Nature encourages putting each legend with its figure at first submission; in the final paper, all legends are listed together after the main reference list, separate from the figure files | Fewer than 300 words each |
| PLOS ONE | In the manuscript text, straight after the paragraph where the figure is first cited; not in the image file | Label ‘Fig 1’; title of 15 words or fewer; legend after the title |
| Wiley | Preferred at submission: a separate ‘Figure legend’ section after the references; also accepted, and preferred after acceptance: anywhere that clearly shows which figure it explains | Arabic numerals in order of appearance |
| APA Style | Number in bold above the image; title one double-spaced line below the number; notes underneath | Title in italic title case; legend (key) inside the image’s borders |
| University of the West of England (UWE Bristol) | Title below figures and charts (and above tables) | A number in order of appearance and a meaningful title |
Sources: Nature formatting guide; PLOS ONE, Wiley and APA Style guidance on figures; UWE Bristol library guidance on figures and tables.
In a thesis or dissertation
Your university’s thesis regulations or your department’s handbook set the format, so check them first. UWE’s guidance puts the title below the image, but APA Style puts it above.
Longer works may number figures by chapter, if your guidelines allow it. Sheffield Hallam University’s library guide gives Figure 1.1 and 1.2 in chapter 1, then Figure 2.1 in chapter 2. Whichever you use, number figures in order and list them in the list of figures at the front of your thesis. Large supporting figures can go in an appendix, with a legend that works on its own.
In a journal submission
Follow the journal’s author guidelines to the letter, because the three publishers we checked differ on where legends go. If the paper has a Methods section, Nature rules out methods details in legends. If you’re publishing your first paper, read the journal’s guidelines on figures before you make them, not after.
In APA Style
Use APA’s terms: the explanation is a note, and the legend is the key to symbols. Above the image, put the number in bold, then the italic title one double-spaced line below it. Put any explanation in a note underneath, and keep the key inside the image’s borders.
Common mistakes to avoid
Before you submit, check your legend against these slips, each drawn from the guidelines above:
- Undefined error bars or statistics. Nature requires both to be defined in the legend. The formatting guide doesn’t list what that means (it points to Nature’s separate statistics guidance), so at a minimum say whether the error bars show standard deviation or standard error, give the sample size and name the test.
- Unexplained abbreviations and symbols. Spell them out in the legend, even if you defined them in the text. Our guide to a list of abbreviations covers how to handle them across a thesis.
- Interpreting the results. For a thesis or coursework, Newcastle University’s guidance says: ‘Don’t interpret the results here, this should happen in the main text.’ Some journals accept one sentence on what the data show: the Nature Communications example above has one. So check your journal’s published papers.
- Methods that belong elsewhere. If there’s a Methods section, Nature says legends shouldn’t contain methods details.
- A title that covers only one panel. The title should cover every panel.
- Figures numbered out of order. Wiley and UWE ask for figures in the order they appear, APA in the order you mention them, and PLOS ONE asks you to cite them in order.
- Relying on the legend alone. Klionsky advises putting the key information on the image itself. Nature, by contrast, prefers keys to symbols in the legend rather than on the image where possible, so check your journal.
Need a refresher on the statistics behind your chart? Our guide to the statistical treatment of data explains descriptive and inferential statistics and type I and II errors.
What to do next
Find the guidelines your figure legend has to follow, whether that’s your thesis regulations, a journal’s author guide or APA Style. Then write each legend with the parts above and check it against the mistakes list. When the figures are done, add them to your list of figures, and you’re ready for the next part of your write-up.
Sources